

Lesson 2.2 Airspeed Indicator
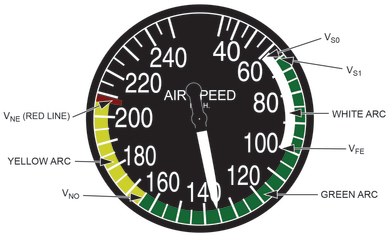
1. Airspeed indicators have several color-coded markings.
a. The white arc is the flap operating range.
1. The lower limit is the power-off stalling speed or the minimum steady flight speed with wing flaps and landing gear in the landing position (VS0).
2. The upper limit is the maximum flap extended speed (VFE).
b. The green arc is the normal operating range.
1. The lower limit is the power-off stalling speed with the wing flaps up and landing gear retracted (VS1).
2. The upper limit is the maximum structural cruising speed for normal operation (VNO).
c. The yellow arc is the range of airspeed that is safe in smooth air only.
1. It is known as the caution range.
d. The red line is the speed that should never be exceeded (VNE).
1. Design limit load factors could be exceeded with airspeeds in excess of VNE from a variety of phenomena.
2. The most important speed limitation that is not color-coded is the design maneuvering speed (VA).
a. The design maneuvering speed is the speed below which you can move a single flight control one time to its full deflection for one axis of airplane rotation only (pitch, roll, or yaw), in smooth air, without risk of damage to the airplane.
b. It is the maximum speed for flight in turbulent air.
c. It is the maximum speed at which an airplane may be stalled safely.
3. The maximum landing gear extended speed (VLE) is not color-coded.
a. It is usually placarded and is included in the airplane’s flight manual.
4. Types of Airspeed
a. Indicated airspeed (IAS) is read directly off the airspeed indicator.
b. Calibrated airspeed (CAS) is IAS corrected for installation and instrument error.
c. True airspeed (TAS) is CAS corrected for pressure altitude and nonstandard temperature.
5. The V-G diagram (velocity vs. “G” loads) shows the flight operating strength of an airplane.
a. In the diagram below, load factor is on the vertical axis with airspeed on the horizontal axis.
b. The dashed lines, the first important items on the diagram, show maximum lift capability.
1. The subject airplane in the diagram below is capable of developing no more than one positive “G” at 64 MPH, which is the wings-level stall speed of the airplane.
2. The maximum load factor increases dramatically with airspeed. The airplane’s maximum positive lift capability is 2 “G” at 96 MPH, 3 “G” at 116 MPH, 3.8 “G” at 126 MPH, etc. These are the “coordinates” of points on the curved line up to point C.
3. Any load factor above this dashed line is unavailable aerodynamically. That is, the subject airplane cannot fly above the line of maximum lift capability (it will stall).
c. Point C is the intersection of the positive limit load factor (line CDE) and the line of maximum positive lift capability (dashed line up to point C).
1. The airspeed at this point [usually called the design maneuvering speed (VA)] is the minimum airspeed at which the limit load can be developed aerodynamically.
2. Any airspeed greater than point C provides a positive lift capability sufficient to damage the airplane. Any airspeed less than point C does not provide positive lift capability sufficient to cause damage from excessive flight loads.
d. The limit airspeed VNE is a design reference point for the airplane. The subject airplane is limited to 196 MPH (line EF). If flight is attempted beyond the limit airspeed, structural damage or structural failure may result from a variety of phenomena.
e. Thus, the airplane in flight is limited to a regime of airspeeds and Gs that do not exceed
1. The limit (or red-line) speed (line EF)
2. Normal stall speed (line AJ)
3. The positive and negative limit load factors (lines CDE and IHG)
4. The maximum lift capability (dashed lines up to C, down to I)
f. A caution range is indicated between points D, E, F, and G. Within this range, certain factors must be considered to maintain flight in the envelope. Line DG represents the maximum structural cruising speed (VNO).
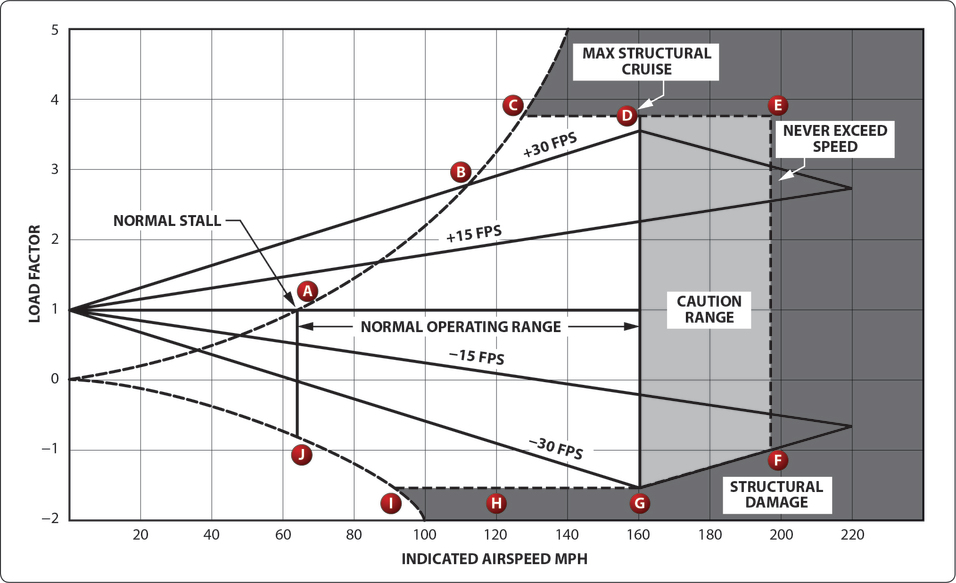
Figure 5. Velocity vs. Load Factor.